การวิเคราะห์ Log และวางแผน Observability เบื้องต้น คือพื้นฐานสำคัญของ ระบบที่ตรวจสอบได้ (Observable System) ซึ่งช่วยให้:
- แก้ไขปัญหาได้เร็ว (Mean Time to Resolution ↓)
- เข้าใจพฤติกรรมของระบบแบบ “ไม่ต้องเดา”
- เตรียมพร้อมรองรับ Incident / Scalability
🔍 Observability คืออะไร?
ความสามารถในการเข้าใจภายในของระบบจากภายนอก โดยอาศัยข้อมูลเช่น log, metric, และ trace
มันไม่ใช่แค่ Logging — แต่คือการ “มองเห็นภาพรวมของระบบ”
จุดเริ่มต้นสำหรับ Observability
| Pillar | อธิบาย |
|---|---|
| Logs | บันทึกเหตุการณ์ที่เกิดขึ้น เช่น error, info, warning |
| Metrics | ค่าที่วัดได้ เช่น CPU, request/sec, error rate |
| Traces | การตามเส้นทาง request ข้าม service → ช่วย debug distributed system |
วางมาตรฐาน Logging
| สิ่งที่ควรทำ | ตัวอย่าง |
|---|---|
| ✅ Format เป็น JSON | ง่ายต่อการ parse และ search |
| ✅ Include Trace ID / Correlation ID | เพื่อเชื่อมโยง log แต่ละ service |
| ✅ ระบุ log level ที่เหมาะสม | info, warn, error, debug |
| ✅ ระบุ context | userId, sessionId, source |
| ✅ เขียนเป็น structured log | {"event": "UserLogin", "userId": "123"} |
เก็บ Log แบบ Centralized
| Tool | ความสามารถ |
|---|---|
| ELK Stack (Elasticsearch + Logstash + Kibana) | Classic, powerful, search ดี |
| Loki + Grafana | Lightweight, เหมาะกับ Kubernetes |
| Fluentd / Fluent Bit | Forward log จาก container → storage |
| Cloud Native เช่น GCP Logging / AWS CloudWatch | สะดวกกับ multi-region |
Metrics Monitoring
| ควรวัด | ตัวอย่าง |
|---|---|
| ✅ Performance | Request latency, Throughput, DB time |
| ✅ Availability | Uptime, Error Rate, 5xx count |
| ✅ Resource Usage | CPU, RAM, Connection Pool, Queue Size |
Implement Distributed Tracing
- ใช้ library เช่น OpenTelemetry, Zipkin, Jaeger
- ทุก request/request-response ต้องมี trace-id
- ผูก trace แต่ละ request กับ log + metric ที่เกิดระหว่างทาง
วาง Alert และ Dashboard
| คำแนะนำ | ตัวอย่าง |
|---|---|
| ✅ ตั้ง Alert เมื่อ error rate > 5% | Slack / Email |
| ✅ ทำ dashboard status ของแต่ละ service | ใช้ Grafana |
| ✅ แยก dev / prod dashboard | เพื่อลด noise |
อย่า Log เยอะเกินจนเปลือง storage → ระวัง log level!
Log ทุก request ที่ fail (4xx, 5xx) พร้อม context
เริ่มจาก “service สำคัญ” ก่อน เช่น Auth, Payment
อย่าลืม log พฤติกรรมของ user ด้วย (ไม่ใช่แค่ error)
| หมวด | รายการ |
|---|---|
| Log Format | JSON + traceId + level |
| Central Log | ใช้ Fluent Bit → Loki + Grafana |
| Metrics | Prometheus + Grafana (CPU, errorRate) |
| Trace | OpenTelemetry + Jaeger |
| Alert | Grafana alert + Slack integration |
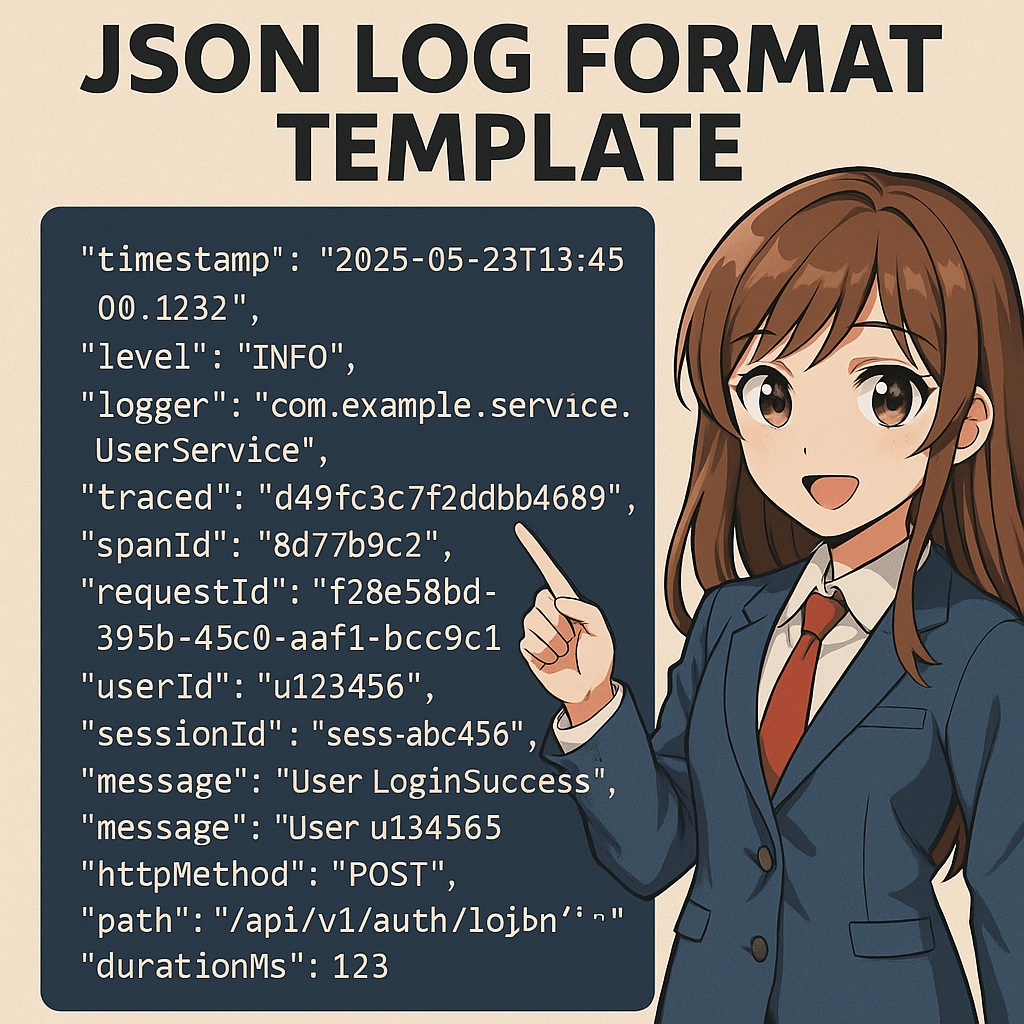
{
“timestamp”: “2025-05-23T13:45:00.123Z”,
“level”: “INFO”,
“logger”: “com.example.service.UserService”,
“thread”: “http-nio-8080-exec-3”,
“traceId”: “d49f3c7f2bdb4689”,
“spanId”: “8d77b9c2”,
“requestId”: “f28e58bd-395b-45c0-aaf1-bcc9c61c68ee”,
“userId”: “u123456”,
“sessionId”: “sess-abc456”,
“event”: “UserLoginSuccess”,
“message”: “User u123456 logged in successfully”,
“httpMethod”: “POST”,
“httpStatus”: 200,
“path”: “/api/v1/auth/login”,
“durationMs”: 123,
“clientIp”: “203.0.113.45”,
“service”: “auth-service”,
“environment”: “production”
}

ใส่ความเห็น